Bluefors LD Trainer: follow the helium, one step at a time
An interactive introduction to dilution refrigeration, with a controller, visible gas paths, and time to stop and look.
In this entry
I have published Bluefors LD Trainer, a small interactive tool for learning how a dilution refrigerator works. My aim is to connect the controls on the screen with the gas paths and cooling processes inside the machine. You can open the simulator in your browser without installing anything.
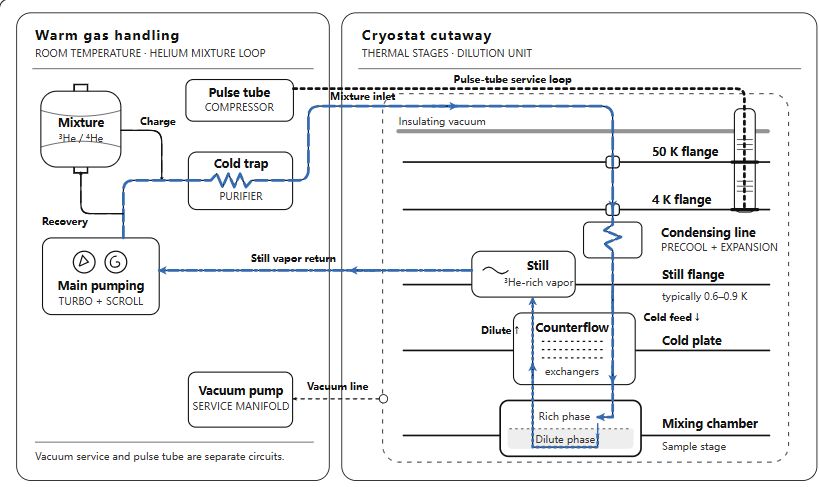
The circulation stage in the simulator. This is a simplified functional schematic of an LD-family system. Blue marks the active helium mixture flow.
The trainer covers six stages, from pumping the insulating vacuum and starting pulse-tube precooling, through condensation and dilution circulation, to mixture recovery and warmup. It opens in Slides mode. Each step holds the temperature readouts and flow paths still, so there is time to inspect them before pressing Next slide. Continuous mode lets you watch the cooldown evolve at a slower pace, with pause and speed controls. Its automatic walkthrough ends at circulation. Click a component to read what it does.
One distinction I wanted to make visible is between the insulating vacuum, the pulse tube’s separate helium circuit, and the circulating helium-3/helium-4 mixture. The mixture produces cooling when helium-3 crosses from the concentrated phase into the dilute phase in the mixing chamber. The still preferentially evaporates helium-3, and the pumping system returns it through the inlet to sustain circulation. Bluefors has a useful explanation of the underlying dilution cycle.
For a first experiment, advance to Slide 4, Circulate and increase the sample heat load while leaving the still heater fixed. Release the slider to update the response and watch the modeled mixing-chamber temperature rise. Then reduce the sample heat load and change the still heater to explore how the modeled circulation responds. The five temperature readouts, logarithmic history chart, and phase-boundary cutaway show different parts of the same process.
The model is deliberately limited. Startup and recovery use illustrative relaxation dynamics, and the low-temperature response uses an ideal dilution-cooling approximation. The times, temperatures, and slider responses are synthetic. They are not calibrated predictions for a particular refrigerator. The diagram also omits a real system’s detailed valve map, pressure dynamics, and interlocks. This is an independent educational project, unaffiliated with Bluefors. Operating real equipment requires its actual documentation and local training.
The project is released under the MIT license. You can read the source on GitHub, or download the standalone HTML file and open it offline. The v0.1.0 release includes the current version. If a flow path is confusing, a physical explanation needs correcting, or a classroom exercise would help, please open an issue. I hope this gives students and new researchers a useful place to begin asking how the refrigerator works.